> ## Documentation Index
> Fetch the complete documentation index at: https://docs.primal.trade/llms.txt
> Use this file to discover all available pages before exploring further.
# Reading a story
> The anatomy of a Wire dossier: the write-up, the community read, the live market, and the four audit panels that let you disagree with all of it.
A dossier is four blocks that answer four different questions: what is being said, how the crowd
is saying it, what the market is doing, and whether the token underneath deserves any of it.
## The write-up
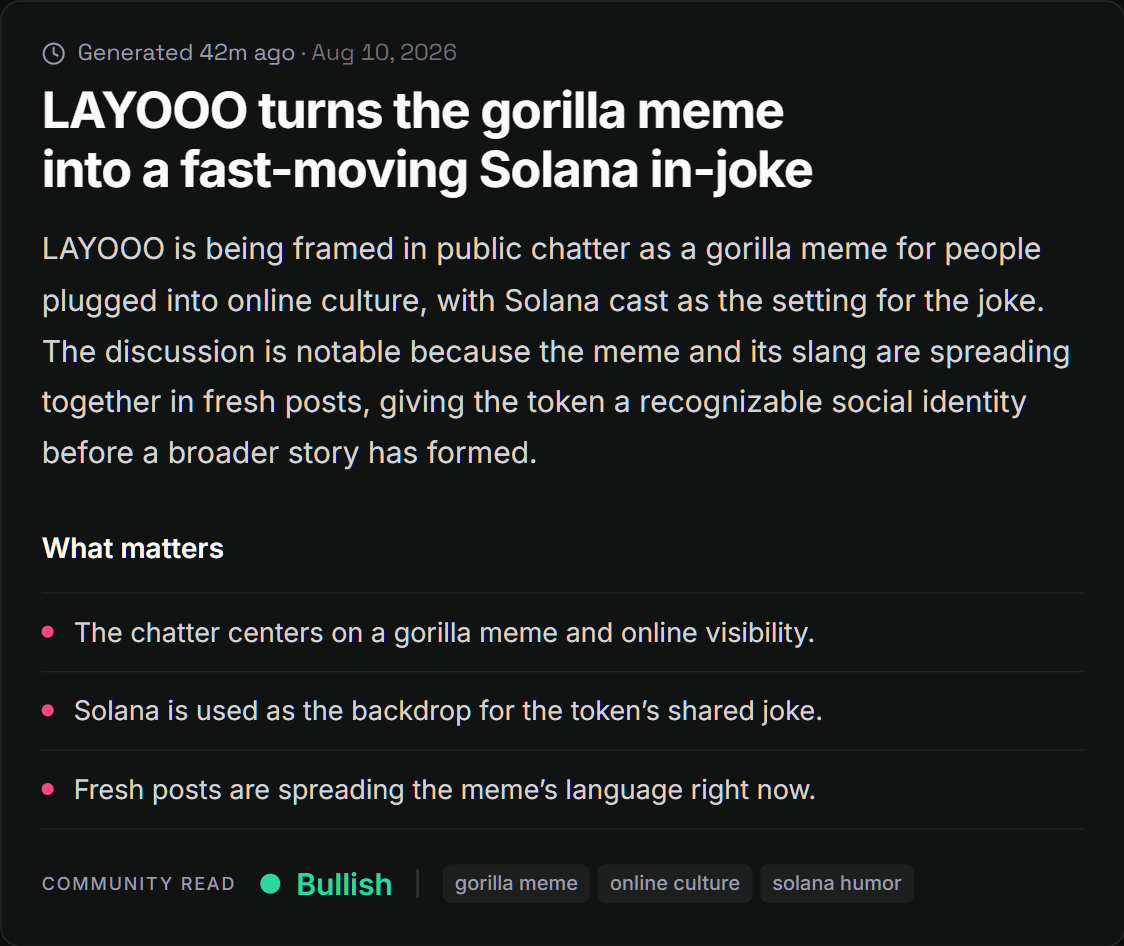 The byline reads **Generated**, and it carries the time this version of the story went out. The
story stays this short: a few sentences on what the chatter actually says, then **What matters**,
the three points the desk considers load bearing, in plain language.
Notice what the example does. It attributes the meme to public chatter rather than asserting it,
and it says outright that no broader story has formed yet. Both of those are in the write-up
itself, not in a disclaimer under it. That is the desk working correctly.
## Community read, and the gap it exposes
**Community read** is the desk's summary of the social evidence only: bullish, mixed, or bearish,
with the themes it found. Market conditions never feed this line.
That separation is the useful part. A token can be up hard on the day while its community read
stays mixed, which tells you the price is moving without the crowd's conviction behind it. The
reverse happens too: a bullish read under a flat chart is a story the market has not priced yet.
Neither is a recommendation. Both are worth knowing before you size a position.
## The market, live
The strip above the story carries market cap, 24h volume, transactions, holders, net flow and
fees. The chart beside it is the real trading chart: 1m, 5m, 15m and 1h candles, free pan and
zoom across the series the desk serves for that story, with linear and logarithmic scales in its
settings. On a token that ran from nothing, log scale is the one that shows you the climb.
## Written and live on the same page
The byline reads **Generated**, and it carries the time this version of the story went out. The
story stays this short: a few sentences on what the chatter actually says, then **What matters**,
the three points the desk considers load bearing, in plain language.
Notice what the example does. It attributes the meme to public chatter rather than asserting it,
and it says outright that no broader story has formed yet. Both of those are in the write-up
itself, not in a disclaimer under it. That is the desk working correctly.
## Community read, and the gap it exposes
**Community read** is the desk's summary of the social evidence only: bullish, mixed, or bearish,
with the themes it found. Market conditions never feed this line.
That separation is the useful part. A token can be up hard on the day while its community read
stays mixed, which tells you the price is moving without the crowd's conviction behind it. The
reverse happens too: a bullish read under a flat chart is a story the market has not priced yet.
Neither is a recommendation. Both are worth knowing before you size a position.
## The market, live
The strip above the story carries market cap, 24h volume, transactions, holders, net flow and
fees. The chart beside it is the real trading chart: 1m, 5m, 15m and 1h candles, free pan and
zoom across the series the desk serves for that story, with linear and logarithmic scales in its
settings. On a token that ran from nothing, log scale is the one that shows you the climb.
## Written and live on the same page
 | | Written at publication | Live |
| ------------- | ---------------------------------------------------------- | ---------------------------------- |
| What | Story, What matters, community read, community pulse | Market strip, chart, audit panels |
| Why | It describes the conversation at that moment | It is what the market is doing now |
| Changes later | Only if the desk republishes, and the byline moves with it | Continuously |
The dot beside the chart tells you which state the chart itself is in. It reads **live** only
while the market cap is actually moving, and **frozen** when it is not. A token that stopped
trading shows frozen because nothing is happening, not because the page broke.
## The audit panels
| | Written at publication | Live |
| ------------- | ---------------------------------------------------------- | ---------------------------------- |
| What | Story, What matters, community read, community pulse | Market strip, chart, audit panels |
| Why | It describes the conversation at that moment | It is what the market is doing now |
| Changes later | Only if the desk republishes, and the byline moves with it | Continuously |
The dot beside the chart tells you which state the chart itself is in. It reads **live** only
while the market cap is actually moving, and **frozen** when it is not. A token that stopped
trading shows frozen because nothing is happening, not because the page broke.
## The audit panels
 Four panels finish the dossier, running the same checks as the rest of the terminal:
* **Holders**: top-10 share, snipers, insiders, bundlers, fresh-wallet swaps
* **Safety**: scam flag, DEX paid, liquidity in dollars and as a percentage, suspicious wallets
* **Smart money**: how many top traders are still in, what they hold and its share of the cap,
realized, net flow
* **Creator**: tokens launched, how many graduated, funding, what the creator sold here and
still holds
This is where a story either survives or falls apart. A narrative about a fresh community reads
differently when the creator panel shows a dozen launches behind it.
## The tags on a card
Each card in the [river](/wire), the story list running down the left of the desk, carries up to
three conditions, computed from chain data rather than from the story:
| Tag | Fires when |
| -------------------------------- | ------------------------------------------------------- |
| `authority live` | Mint or freeze authority is still active |
| `high concentration` | The top holders sit on an outsized share of supply |
| `creator history` | The creator has a launch history worth knowing about |
| `momentum` | Price is up sharply on the day |
| `buy pressure` / `sell pressure` | Buying clearly outweighs selling, or the reverse |
| `low liquidity` | Liquidity is thin enough that one trade moves the price |
| `fresh` | The token launched very recently |
They are not a score. They are the things worth seeing before you read a word of the story.
## Check it yourself
Read the write-up and the community read. Note what the desk claims the crowd believes.
Same screen, no clicks. Does the holder spread, the liquidity, and the creator's history
support the story, or undercut it?
The byline is when the story went out. The market strip is now. The distance between the two
is what you are there to read.
The story is the claim. The panels underneath are the evidence. Read them in that order and you
will disagree with the desk sometimes, which is the point.
Four panels finish the dossier, running the same checks as the rest of the terminal:
* **Holders**: top-10 share, snipers, insiders, bundlers, fresh-wallet swaps
* **Safety**: scam flag, DEX paid, liquidity in dollars and as a percentage, suspicious wallets
* **Smart money**: how many top traders are still in, what they hold and its share of the cap,
realized, net flow
* **Creator**: tokens launched, how many graduated, funding, what the creator sold here and
still holds
This is where a story either survives or falls apart. A narrative about a fresh community reads
differently when the creator panel shows a dozen launches behind it.
## The tags on a card
Each card in the [river](/wire), the story list running down the left of the desk, carries up to
three conditions, computed from chain data rather than from the story:
| Tag | Fires when |
| -------------------------------- | ------------------------------------------------------- |
| `authority live` | Mint or freeze authority is still active |
| `high concentration` | The top holders sit on an outsized share of supply |
| `creator history` | The creator has a launch history worth knowing about |
| `momentum` | Price is up sharply on the day |
| `buy pressure` / `sell pressure` | Buying clearly outweighs selling, or the reverse |
| `low liquidity` | Liquidity is thin enough that one trade moves the price |
| `fresh` | The token launched very recently |
They are not a score. They are the things worth seeing before you read a word of the story.
## Check it yourself
Read the write-up and the community read. Note what the desk claims the crowd believes.
Same screen, no clicks. Does the holder spread, the liquidity, and the creator's history
support the story, or undercut it?
The byline is when the story went out. The market strip is now. The distance between the two
is what you are there to read.
The story is the claim. The panels underneath are the evidence. Read them in that order and you
will disagree with the desk sometimes, which is the point.